

Penguins in Argentina
Penguin Research
Article begins beneath Menu


.
Bingham M (1999) Field Guide to Birds of the Falkland Islands.
.
ADOPT A PENGUIN TO HELP SUPPORT OUR WORK
.
PUBLICACIONES CIENTIFICOS EN ESPANOL:
.
Bingham M (2004) Manual de Instrucción para Monitoreo de Aves Marinas.
.
------------------------------
Magellanic penguins (Spheniscus magellanicus) are found only in South America, with breeding populations in Chile, Argentina and the Falklands (Malvinas). On Magdalena Island an initial increase in population (59,000 pairs in 2000/01 to 63,000 pairs in 2008/2009) was followed by a population decline (to 43,000 pairs in 2018/19) following a severe drought during 2009 that has left much of the island less suitable for nesting in burrows. The nearby colony situated in Argentina between the lighthouses of Cabo Vírgenes and Punta Dungeness has increased in population from 122,000 pairs in 2008/09 to 146,000 pairs in 2018/19. It is likely that this increase is a result of penguins leaving Magdalena Island. Penguins nesting alongside the tourist path showed a reduction in predation and an increase in breeding success.
INTRODUCTION
Magellanic penguins (Spheniscus magellanicus) are found only in southern South America, with breeding populations in Chile, Argentina and the Falklands (Malvinas). Population studies estimate that the world population of Magellanic penguins is between 1.3 and 1.7 million breeding pairs, with approximately 700,000 pairs in Chile, 900,000 pairs in Argentina and 100,000 pairs in the Falklands (Falabella & Campagna (Eds) 2019, Bingham & Herrmann 2009).
Population studies in the Falklands have shown a 92% decline in Magellanic penguins between 1990/91 and 2018/19 (Falabella & Campagna (Eds) 2019, Bingham 2002, Ellis et al. 1996). Removal of fish and squid by the Falklands commercial fishing industry established in 1988 is the principal cause of the Falklands decline, making it difficult for adults to find sufficient food for their chicks, causing high chick mortality, which in turn has led to a lack of recruitment to replace penguins dying from old age. The evidence and mechanism of this decline is outlined in detail in Bingham 2002.
Population studies at the Provincial Reserve Cabo Vírgenes (Argentina) indicate a population of 146,000 reproductive pairs in 2018/19 (Fig 1). Cabo Virgenes is open to the public but visitor numbers are low and there are no tour operators visiting the colony. The nearest town of Rio Gallegos is small and has little tourism, so visitors to the colony are mostly local. Access to the colony is by vehicle along a severely degraded dirt track that is 115 kilometres long, and more suited to off-road vehicles than cars, so visitor numbers are low, averaging about 30 per week during 2019.
One of the largest and most important breeding sites for Magellanic penguins in Chile is located on Magdalena Island in the Straits of Magellan (Fig 1). In 1966 the island was declared a Natural Monument due to its importance as a breeding site for the species, and is managed by CONAF (Corporación Nacional Forestal). Magdalena Island is a popular tourist destination, with an average of 2,500 tourists visiting the island each week during 2018. The tourists arrive by boat in groups of up to several hundred at a time, and follow a set path around the island. Tourists are allowed just one hour ashore by the tour operators, and are accompanied by professional guides. Penguins have an average of two or three visits per day during which people are walking along the path, with a complete absence of tourists between these visits. Hundreds of people in Punta Arenas are directly and indirectly employed by tourism on Magdalena Island.
The aim of this study is to monitor the effects of tourism on the reproduction and survival of penguins at both Magdalena Island and Cabo Virgenes, and to ensure the sustainable use of these reserves as a tourist resource. The study also aims to monitor population trends at these locations and to identify any other problems that may impact on the penguins.

FIGURE SHOWING STUDY SITES
.
MATERIALS AND METHODS
Because Magellanic penguins live below ground in burrows, and over such a large area, direct nest counts are not possible. Many burrows are unoccupied, or are occupied by non-breeding single adults, so to assume that all burrows contain nests would greatly over-estimate the population size. To count breeding pairs it is necessary to look inside each burrow to confirm the presence of eggs shortly after laying. For Magellanic penguins it is necessary to establish fixed study plots to obtain long-term population data (Hiscock 1993, Bingham 2004, Bingham and Herrmann 2009).
In December 1998, studies began on Magdalena Island to determine the number of plots required for an island with such a varied terrain and soil type. Habitat maps were prepared, along with a population census of all bird species found on the island (Bingham & Herrmann 2009).
With funding from the British government, seven fixed study-plots were established on Magdalena Island in 1999 to estimate penguin population trends, six plots of 50 metres by 50 metres, and one plot of 30 metres by 100 metres. Every single burrow within these plots was examined each year in late October to determine the number of occupied nests, and this was used to estimate the average breeding density in nests per square metre. The nesting area was also mapped out by GPS, and multiplying the breeding area of the island in square metres, by the average number of nests per square metre, an estimate of the island’s population size was obtained.
The greatest margin of error in determining population size using this method is in the assumption that breeding density recorded in the plots is representative of the entire island, but by using permanent study plots year after year, this margin for error is eliminated when looking for changes in population size. Even minor changes in breeding density, and hence population size and trends, can be measured with accuracy using permanent study plots, even though a greater margin of error is implied when extending this to defining an actual population size in any particular year (Hiscock 1993).
In addition to studying population changes, in late October, shortly after egg-laying, around 20 occupied nests in each plot were marked, and these nests were visited regularly throughout the season, to determine what proportion of eggs hatch, how many chicks survive to leave the nest, the major causes of egg and chick loss, and chick weight. In addition to the seven study plots, occupied nests alongside the tourist path were also marked and studied, to look for differences in breeding success and chick survival rates resulting from the presence of large numbers of tourists.
The same methodology was employed to study Magellanic penguin populations at Cabo Vírgenes since 2003 (Fig 1). Unlike Magdalena Island, Cabo Vírgenes has dense thorn bushes, and the penguins nest above ground underneath the bushes instead of making burrows. Five fixed plots of 50 metres by 50 metres were used at Cabo Vírgenes where the terrain is much more uniform and there is much less variation in nesting density. Nests alongside the tourist path were also marked and studied to look for differences caused by the presence of visitors.
RESULTS
Magdalena Island colony
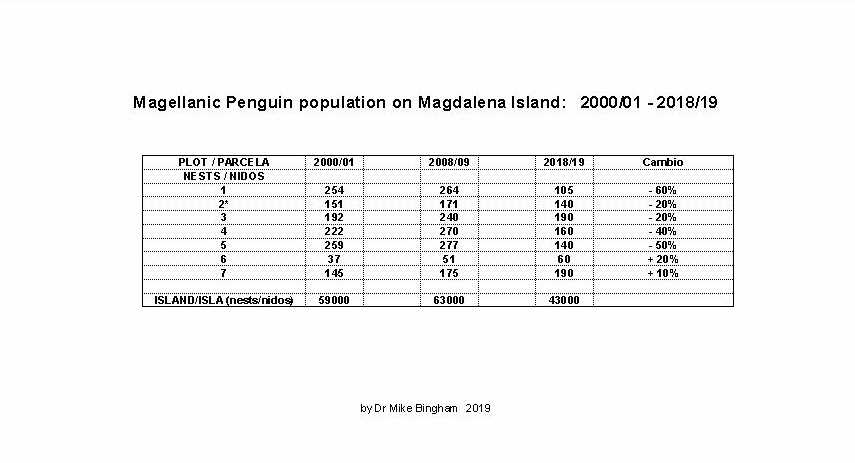
Seven fixed study-plots were established on Magdalena Island to estimate penguin population trends. These plots indicated populations of 59,000 breeding pairs in 2000/01, 63,000 pairs in 2008/09, and 43,000 pairs in 2018/19 (Table 1).
Magellanic penguins make their nests in burrows on Magdalena Island. Prior to the drought of 2009 penguins nested over almost the entire island, so population increases could not occur as a result of increases in nesting area, only through increases in nesting density, which is limited for penguins that nest in burrows. The island had short grass with deep roots that stabilised the soil enough to support burrows over most of the island. In 2009 and 2010 the island suffered a severe drought that killed off all the vegetation leaving just bare soil. Without vegetation, the wind caused loose soil to be blown across the island (Fig 2), covering and burying burrows, eggs and chicks (Fig 3). This caused very low breeding success, and reduced the available nesting area of the island. The vegetation is now recovering over much of the island, however despite the return of vegetation, many areas still have soil below the surface that is too sandy and unstable to support the construction of burrows, reducing both the available nesting area and the nesting density of the colony.

LOOSE SOIL BEING BLOWN ACROSS MAGDALENA ISLAND BURYING NESTS
.

PENGUIN BURROW BEING BURIED BY SOIL. THE PENGUIN CAN ESCAPE BUT THE EGGS ARE LOST
.
During 2018/19 a comparison of the fixed plots indicated large population changes since 2008/09. Five of the seven plots showed a decline in the number of occupied nests, ranging from -20% to -60% (Table 1). However an increase of 10 to 20% in the number of occupied nests was observed in two plots (Table 1). The majority of the decline on Magdalena has occurred in the flat valleys, with the hills showing a slight increase in population.
.
Plots 1, 4 and 5 are all very similar except for their location. They are all located in flat valleys where the worst of the drought occurred. The loss of almost all the vegetation on the island during the 2009-10 drought caused the wind to lift loose soil and deposit it in these valleys and plains, filling up the burrows, covering the nests, and causing the loss of many burrows. These areas are now covered with fine dusty soil underneath a shallow layer of new vegetation, with a labyrinth of voids below the surface because of the abandoned burrows that were buried.
These areas are no longer very suitable for building new burrows because the burrows collapse too easily. These three plots have registered the highest population decreases on the island. Plots 1 and 5 are linked by the large valley located between the lighthouse and the jetty, while Plot 4 is located on the opposite side of the island where tourists never visit. The plots were chosen to observe differences caused by the presence and absence of tourism in these types of flat terrain.
Plots 2 and 3 are also very similar to each other. Despite being flat these areas have firmer soil and better vegetation, making them more suitable for burrows. Plot 2 is exposed to low presence of tourists while Plot 3 has zero contact with tourism. The decrease in penguins is much lower in both these areas.
Plots 6 and 7 are both on top of hills and both are very similar in terrain, slope and aspect. They are on opposite sides of the island. Plot 6 has zero contact with tourism, while Plot 7 has tourists crossing between the plot and its access to the sea. However both plots have registered an increase in population.
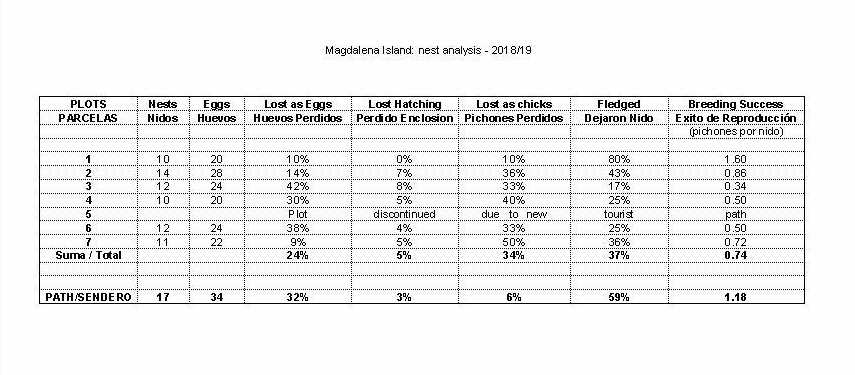
During 2018/19 the mean breeding success on Magdalena Island was 0.74 chicks per nest (range = 0.34 to 1.60), which indicates that 37% of all eggs laid survived to produce a juvenile that left the nest successfully (Table 3). Compared to that figure for the island as a whole, nests placed within two meters of the tourist path had a breeding success of 1.18 chicks per nest, which indicates that 59% of eggs placed very close to tourists survived. Nests within 2 metres of the tourists were 50% more successful than nests situated well away from tourists (Table 3).
.
This breeding success of 1.18 chicks per nest observed near to the tourist path is not only high for 2018/19, it is also high compared to any year for Magdalena in general. Excluding the tourist path, Magdalena Island has not had breeding success of 1.18 in any plot since 2007/08 which was before the drought (Table 3).
Plot 1 is directly located below the lighthouse and is the plot with the highest presence of tourists compared to any other plot on the island. Despite suffering a reduction in nesting density since the drought, during 2018/19 the penguins remaining in Plot 1 had the highest breeding success on the entire island by far. Plot 1 was 60% more successful than any other plot on the island, with an average of 1.6 chicks per nest. A breeding success of 1.6 chicks per nest is exceptional, so exceptional that in 20 years of studies on Magdalena Island only penguins nesting alongside the tourist path have ever registered such a high level of breeding success.
During 2018/19 the breeding success in Plot 1 was more than double the average for the entire island, and raised more chicks per nest than any other plot during the 20 year study period. By comparison, the plots located in areas with zero contact with tourists had the lowest breeding success (0.5 chicks per nest or less).
Cabo Virgenes colony
The Magellanic penguin population at Cabo Vírgenes has increased by 20% during the last 10 years, from 122,000 pairs in 2008/09 to 146,000 pairs in 2018/19. With very few tourists visiting the colony there is no significant difference in breeding success between penguins alongside the tourist path and penguins well away from tourists. The colony at Cabo Virgenes appears to be in good health.

.
DISCUSSION
Magellanic penguins are only found in Argentina, Chile and the Falklands. Population studies are being carried out in all three countries using the same methodology of fixed study plots.
Small colonies of Magellanic penguins can be counted nest by nest, but a direct count is impossible for large colonies such as Cabo Virgenes and Magdalena Island. In such cases it is necessary to calculate the size of the population by plotting the total area of the colony, and multiplying this area by the density of nests per square meter determined by study plots.
According to the criterion given above and the errors inherent in the use of an average nesting density instead of direct counts, the population totals obtained using the aforementioned methodology have a margin of error of plus or minus 20%. There are several methods available to obtain a single population estimate of Magellanic penguins, but only direct counts of every nest can reduce this margin of error. If the objective is to monitor population changes, or compare two or more censuses separated by time, then fixed plots is the only method available for large colonies. Fixed plots allow the precision of direct counts in small areas within the colony.
The use of fixed plots has a margin of error comparable with any other methodology when estimating population size, but with the advantage that using fixed plots eliminates the margin of error when estimating changes in population. Even small population changes can be detected using fixed plots. Other methods of estimating Magellanic penguin populations re-introduce the margin of error with each new count, eliminating any possibility of detecting changes smaller than the combined margin of error of any two counts.
To explain this in layman’s terms, imagine throwing grains of rice onto a large table. Time does not allow each grain to be counted, so instead small squares (study plots) placed randomly across the table can estimate the amount of grains on the table. The estimate will obviously have a large margin of error because it assumes that the density in the squares is representative of the whole table. If the squares are fixed the same result will be recorded each time that the count is repeated. If someone later threw some additional grains onto the table, some additional grains would fall into the squares and the increase would be detected.
If the squares were not fixed, or if other methodology was employed such as transects running across the table at random, the count will be different each time it is repeated, even if the grains on the table have not changed. If the methodology gives different results each time it is repeated, then it is clearly impossible to use such a method to detect small changes.
Long-term population studies using fixed plots began in the Falklands in 1989 (Bingham 2002), on Magdalena Island in 1998, and at Cabo Virgenes in 2003.
The decline of penguins on Magdalena Island is worrying at a local level, but does not indicate a decline at a regional level. At a regional level Magellanic penguins have shown a very slight and statistically insignificant increase over recent years. The increase of 24,000 pairs at Cabo Vírgenes is greater than the loss observed on Magdalena Island during the same period, and it is likely that Cabo Virgenes has benefited from an influx of penguins coming from Magdalena Island. Adding together both colonies gives a population of 185,000 pairs during 2008/09 and 189,000 pairs in 2018/19, an increase of 4,000 pairs over the last 10 years, so the regional population as a whole is healthy and stable.
At Cabo Virgenes the soil is not suitable for burrows, but the area is covered by thorn bushes which the penguins use as protection instead of burrows. There are no bushes at all on Magdalena Island, so without soil suitable for burrows the penguins are left exposed to predators and the weather, forcing them to look elsewhere to breed.
Magdalena Island and Cabo Virgenes are both located in maritime areas that are protected from large-scale commercial fishing by no-fishing zones. Penguins at these sites can usually find plenty of food to feed their chicks, with the exception of during climatic events such as El Niño and La Niña. Penguin populations are tolerant of many problems if food remains abundant.
Magellanic penguin populations on the Falklands have declined by 92% from 1,300,000 pairs in 1990 (Ellis et al. (Eds) 1996) to about 100,000 pairs in 2018 (Falabella & Campagna (Eds.) 2019). This decline is due to competition for food resources with the commercial fishing industry (Bingham 2002). In September 2000 the participants of the Spheniscus Penguin Conservation Workshop held at La Serena (Chile) signed a petition calling on the Falkland Islands Government to establish no-fishing zones around penguin colonies, but that protection has still not been provided, and the penguin population continues to decline (Luna et al 2002 (Eds.), Bingham 2002, Falabella & Campagna (Eds) 2019).
Penguins on Magdalena Island have declined for different reasons. Current data indicate that tourism is not the cause of the decline, and even has a minor role in improving breeding success for a few hundred penguins nesting alongside the tourist path.
The data indicate that penguins nesting in the presence of tourists have higher breeding success than other penguins on the island. During 2018/19 penguins most exposed to tourism had a 50% higher breeding success than the rest of the island. The same was recorded during 2005/06 and 2008/09. In 2009/10 and 2012/13 the penguins closest to tourists recorded a 30% higher breeding success, and on many other occasions the penguins most exposed to tourism recorded superior breeding success of less than 30% higher (Table 2).
The main predator of penguin chicks on Magdalena Island is the Skua (Stercorarius chilensis). The skua is very shy and avoids areas frequented by tourists. A reduction in the abundance of the skua decreases the mortality of chicks and increases the breeding success of the penguins. The data for Magdalena Island indicate that penguins raise more chicks and suffer less mortality of eggs and chicks in the presence of tourists, because the presence of tourists reduces the level of predation by skuas.
One of the main threats to Magdalena Island is the reduction of rainfall necessary to maintain vegetation in order to stabilise the soil so that penguins can dig burrows. The drought that occurred on Magdalena Island in 2009 seems to have been an unusual phenomenon. Before the drought the vegetation mostly comprised of grass species, but following the drought the re-colonisation has largely begun with small ground-hugging flowering plants. If the drought was a cyclic event occurring every 20 years for example, then major changes in vegetation composition would seem unlikely. The change in vegetation indicates that the drought was an unusual event and a link to climate change is a strong possibility.
Even though the vegetation has started to return on much of Magdalena Island, in many areas the number of penguins has continued to decline. The new vegetation has not established the deep roots that the original vegetation had, and the soil underneath is still sandy and collapses easily when penguins try to make burrows. The low-lying valleys are the most seriously affected because these are the areas where dust storms following the drought deposited thick layers of dry dusty soil which collapses too easily to support burrows. Until such time as the vegetation can stabilise these areas the penguin population on Magdalena Island is likely to continue declining.
ACKNOWLEDGEMENTS
My special thanks go to the Chilean National Forestry Corporation (CONAF) and the Consejo Agrario Provincial (CAP), for their help and hospitality. I am also very grateful to the crews of Melinka, Solo Expediciones, Australis, Fueguino, Don Jorge, Hundy and Mandamiento for their logistical support getting me to and from the island. I would like to thank my research assistants Noelia Reineck, Cici Legoe, Christopher Burney, Jennifer Rock, Jon Philipsborne, Joseph Brandt, Nidia Mendez and Elena Mejias. My special thanks to the British Government’s Department for Environment, Food and Rural Affairs for funding the creation of this project through their Darwin Initiative Program.
LITERATURE CITED
Bingham M. (2002) The decline of Falklands penguins in the presence of a commercial fishing industry. Revista Chilena de Historia Natural 75: 805 - 818.
Bingham M. (2004) Manual of Instruction for Monitoring of Seabirds in Isla Magdalena. Report for CONAF
Bingham M. and Herrmann T. (2009) Results of the Magellanic Penguin Studies on Isla Magdalena (Chile) 2000 - 2008. Anales Instituto del Instituto de la Patagonia. Vol. 36. 2
Ellis S., Croxall J. and Cooper J. (Eds) (1996) Penguin Conservation Assessment and Management Plan IUCN/SSC Conservation Breeding Specialist Group.
Falabella V. and Campagna C. (Eds) (2019) Forum for the Conservation of the Patagonian Sea 2019. Report of the IUCN Regional Red List First Workshop for species of the Patagonian Sea.
Hiscock K. (1993) A manual for marine biological inventory surveys. Joint Nature Conservation Committee Report MNCR / OR / 19.
Luna G., Hennicke J., Wallace R., Simeone A., Wolfaardt A., Whittington P., Ellis S. and McGovern M. (Eds) 2002 Spheniscus Penguin Conservation Workgroup Report, IUCN/SSC Conservation Breeding Specialist Group.
.
.
------------------
INTRODUCTION
Magellanic penguins (Spheniscus magellanicus) are only found around southern South America, with breeding populations in Chile, Argentina and the Falkland Islands (Islas Malvinas). Best guess estimates put the current world population of Magellanic penguins at around 1.5 million breeding pairs, with approximately 700,000 pairs in Chile, 650,000 pairs in Argentina and 150,000 pairs in the Falklands/Malvinas (Bingham 2002, Bingham 1998, Bingham & Mejias 1999, Gandini et al. 1998).
Population studies have revealed a 90% decline in Magellanic penguin populations in the Falkland Islands since the establishment of a commercial fishing industry in 1988 (Bingham 2002), making penguin populations in Chile and Argentina even more important. In order to compare these dramatic declines in the Falklands, long-term study programmes were established at Magellanic penguin breeding colonies closest to the Falklands in Chile (1998) and Argentina (2003). Cabo Virgenes is the second largest Magellanic penguin colony in Argentina, and the closest colony in Argentina to the Falklands.
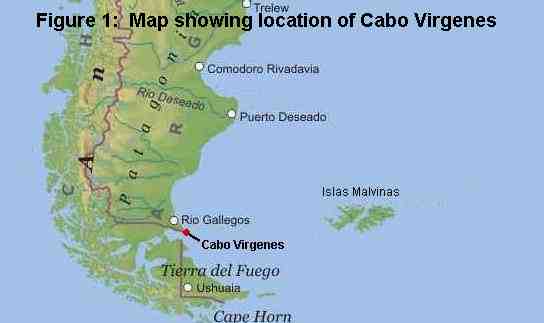
Cabo Virgenes is situated at the northern tip of the mouth of the Straits of Magellan, approximately 80 kilometres south-east of the city of Rio Gallegos (Fig. 1). Cabo Virgenes is a protected nature reserve carrying the title of Cabo Virgenes Provincial Reserve, and since 1993 it has been under the management and protection of the government agency Dirección de Fauna Silvestre y Areas Protegidas.
The penguin colony at Cabo Virgenes is protected from commercial fishing by a no-fishing zone around the colony, called the Special Protection Zone. The colony is becoming increasingly popular as a tourist destination, with visitors arriving daily in cars and minibuses. The colony is protected from excessive disturbance by tourists through the use of a tourist trail that separates tourists from the penguin nests, and by park wardens who monitor the site continuously.
In order to protect and ensure the sustainable use of the reserve as a tourist resource, Cabo Virgenes has been part of a long-term monitoring programme since 2003. This programme monitors annual changes in population, breeding success, chick and egg survival rates, and the effects of tourism, allowing the colony to be managed for the benefit of both tourists and penguins alike.
MATERIALS AND METHODS
Population Census
Because the Magellanic penguins at Cabo Virgenes nest hidden under dense shrubs, over an area of more than 1,00,000 sq.m., a population estimate using a direct count of all nests would be impossible. It was therefore necessary to establish long-term study plots, in which to measure population size and trends (1Bingham 2004).
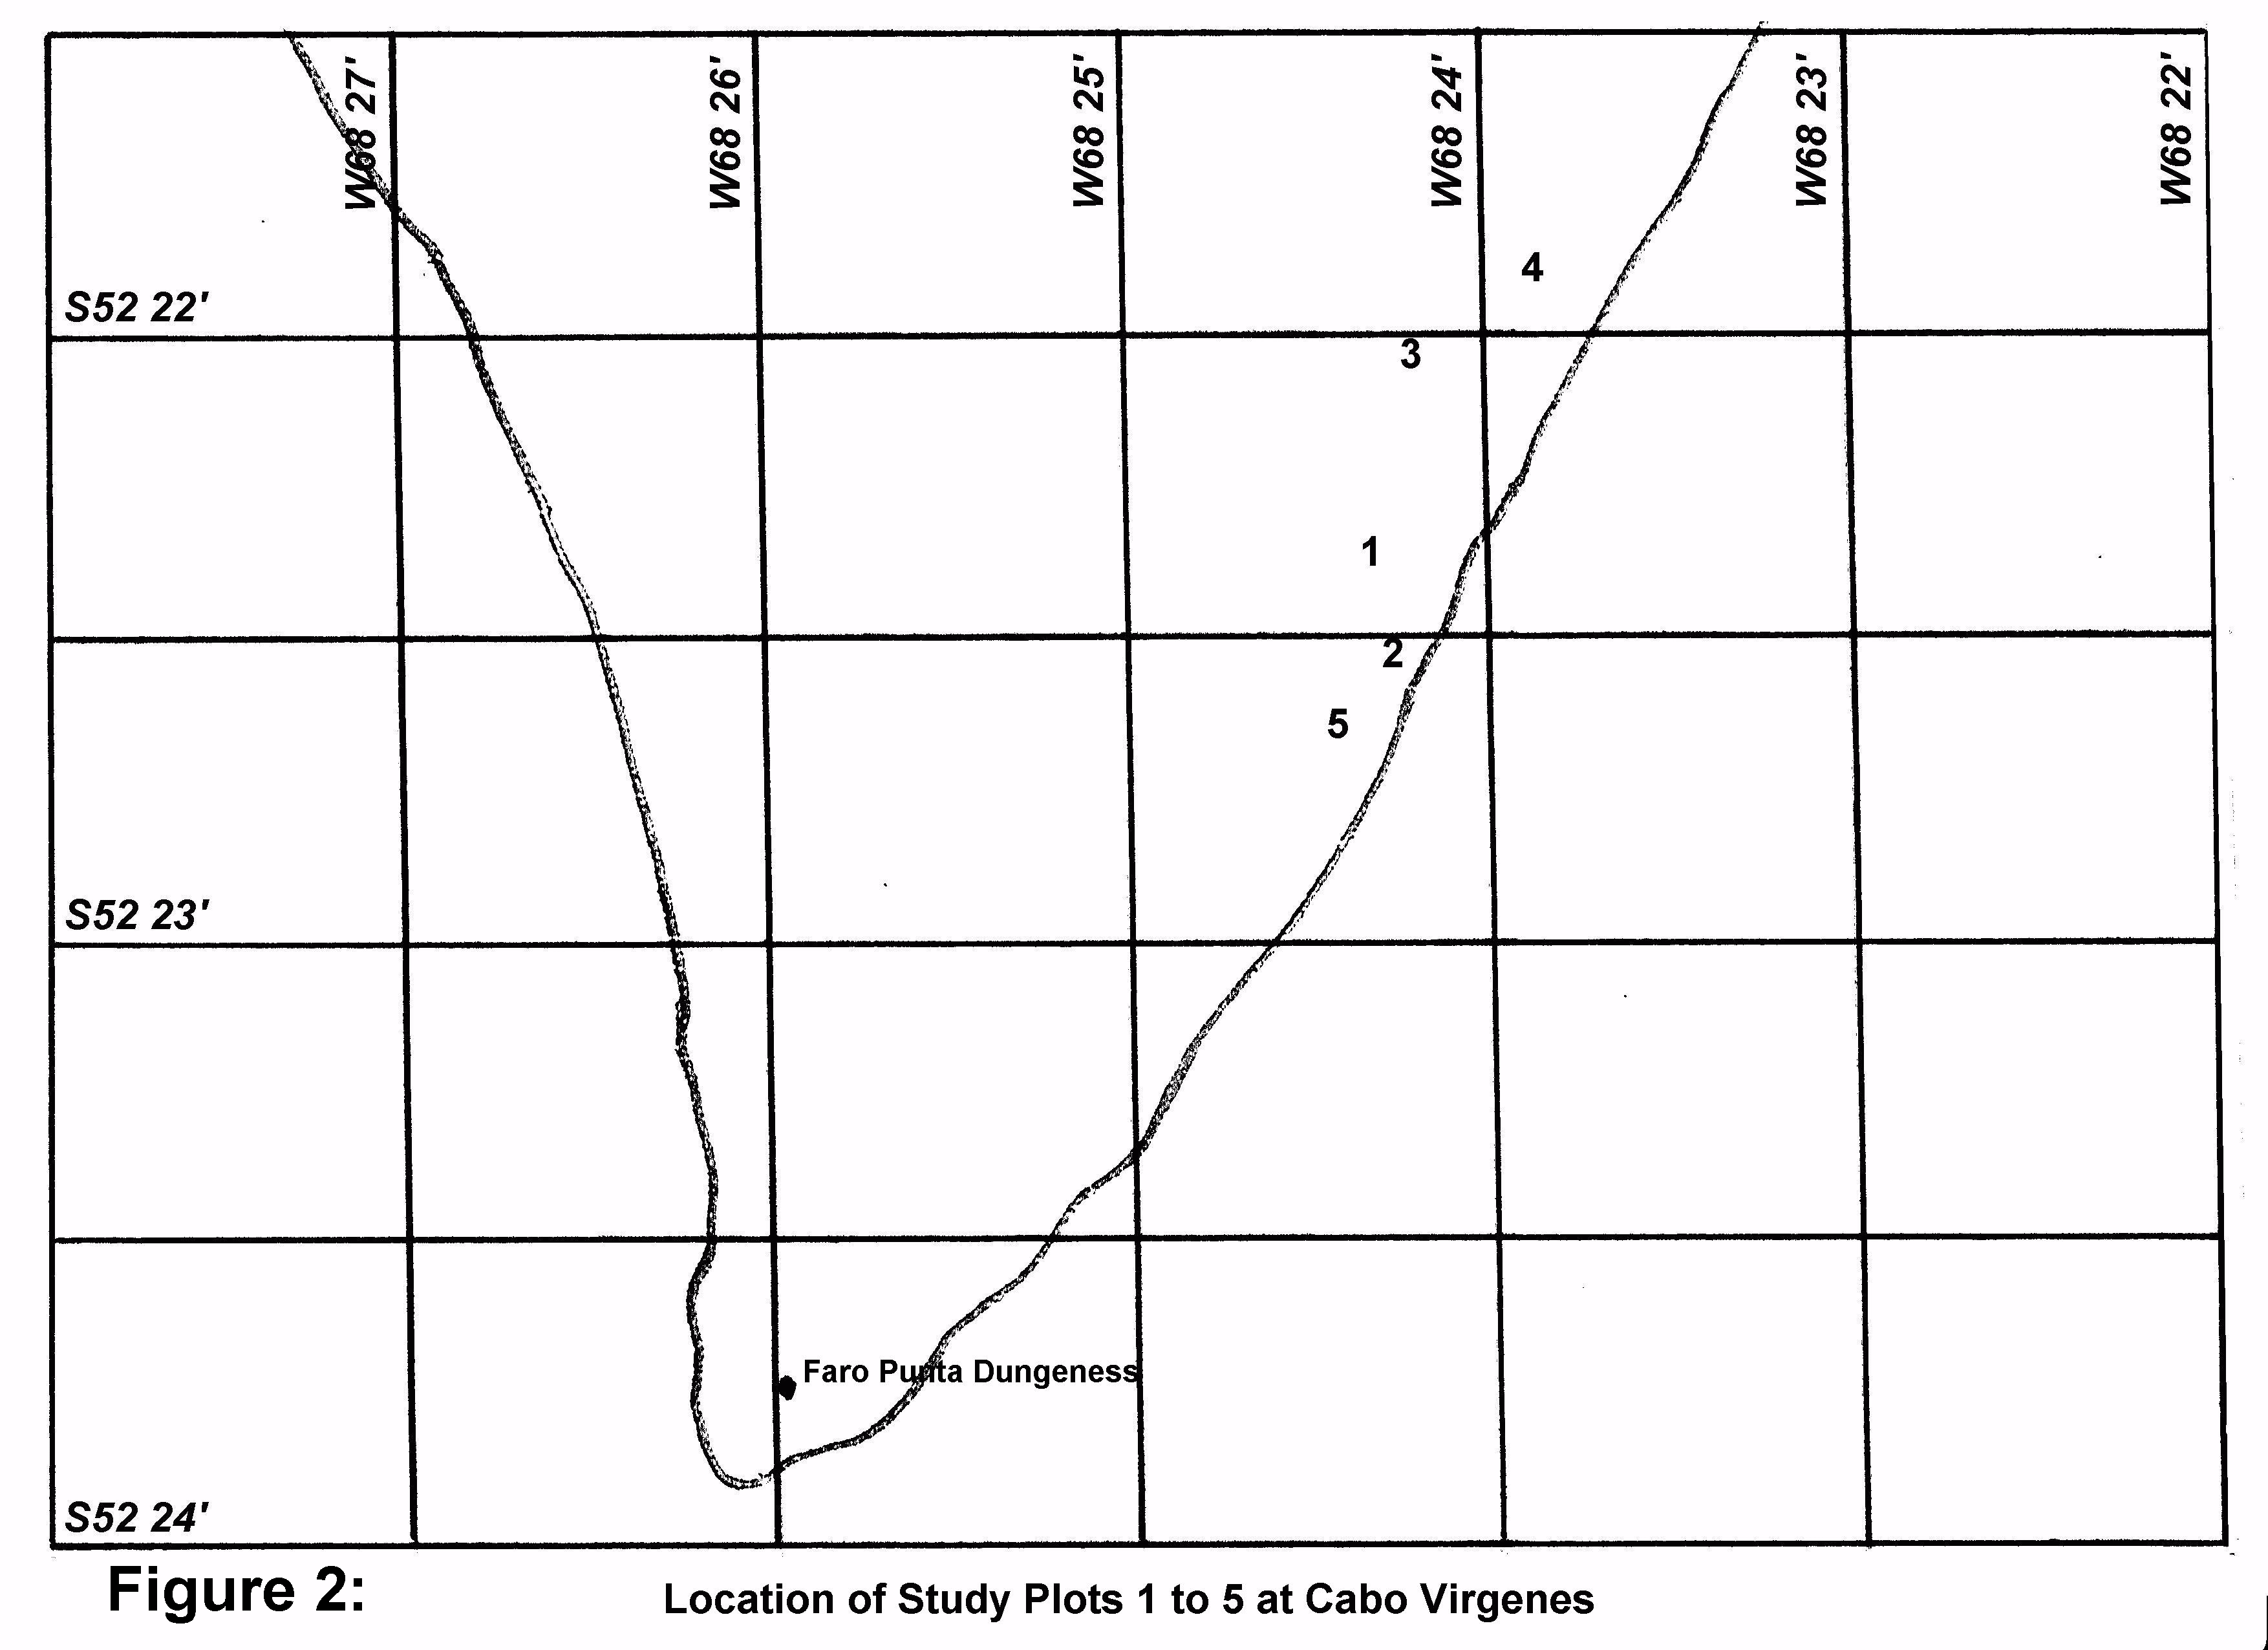
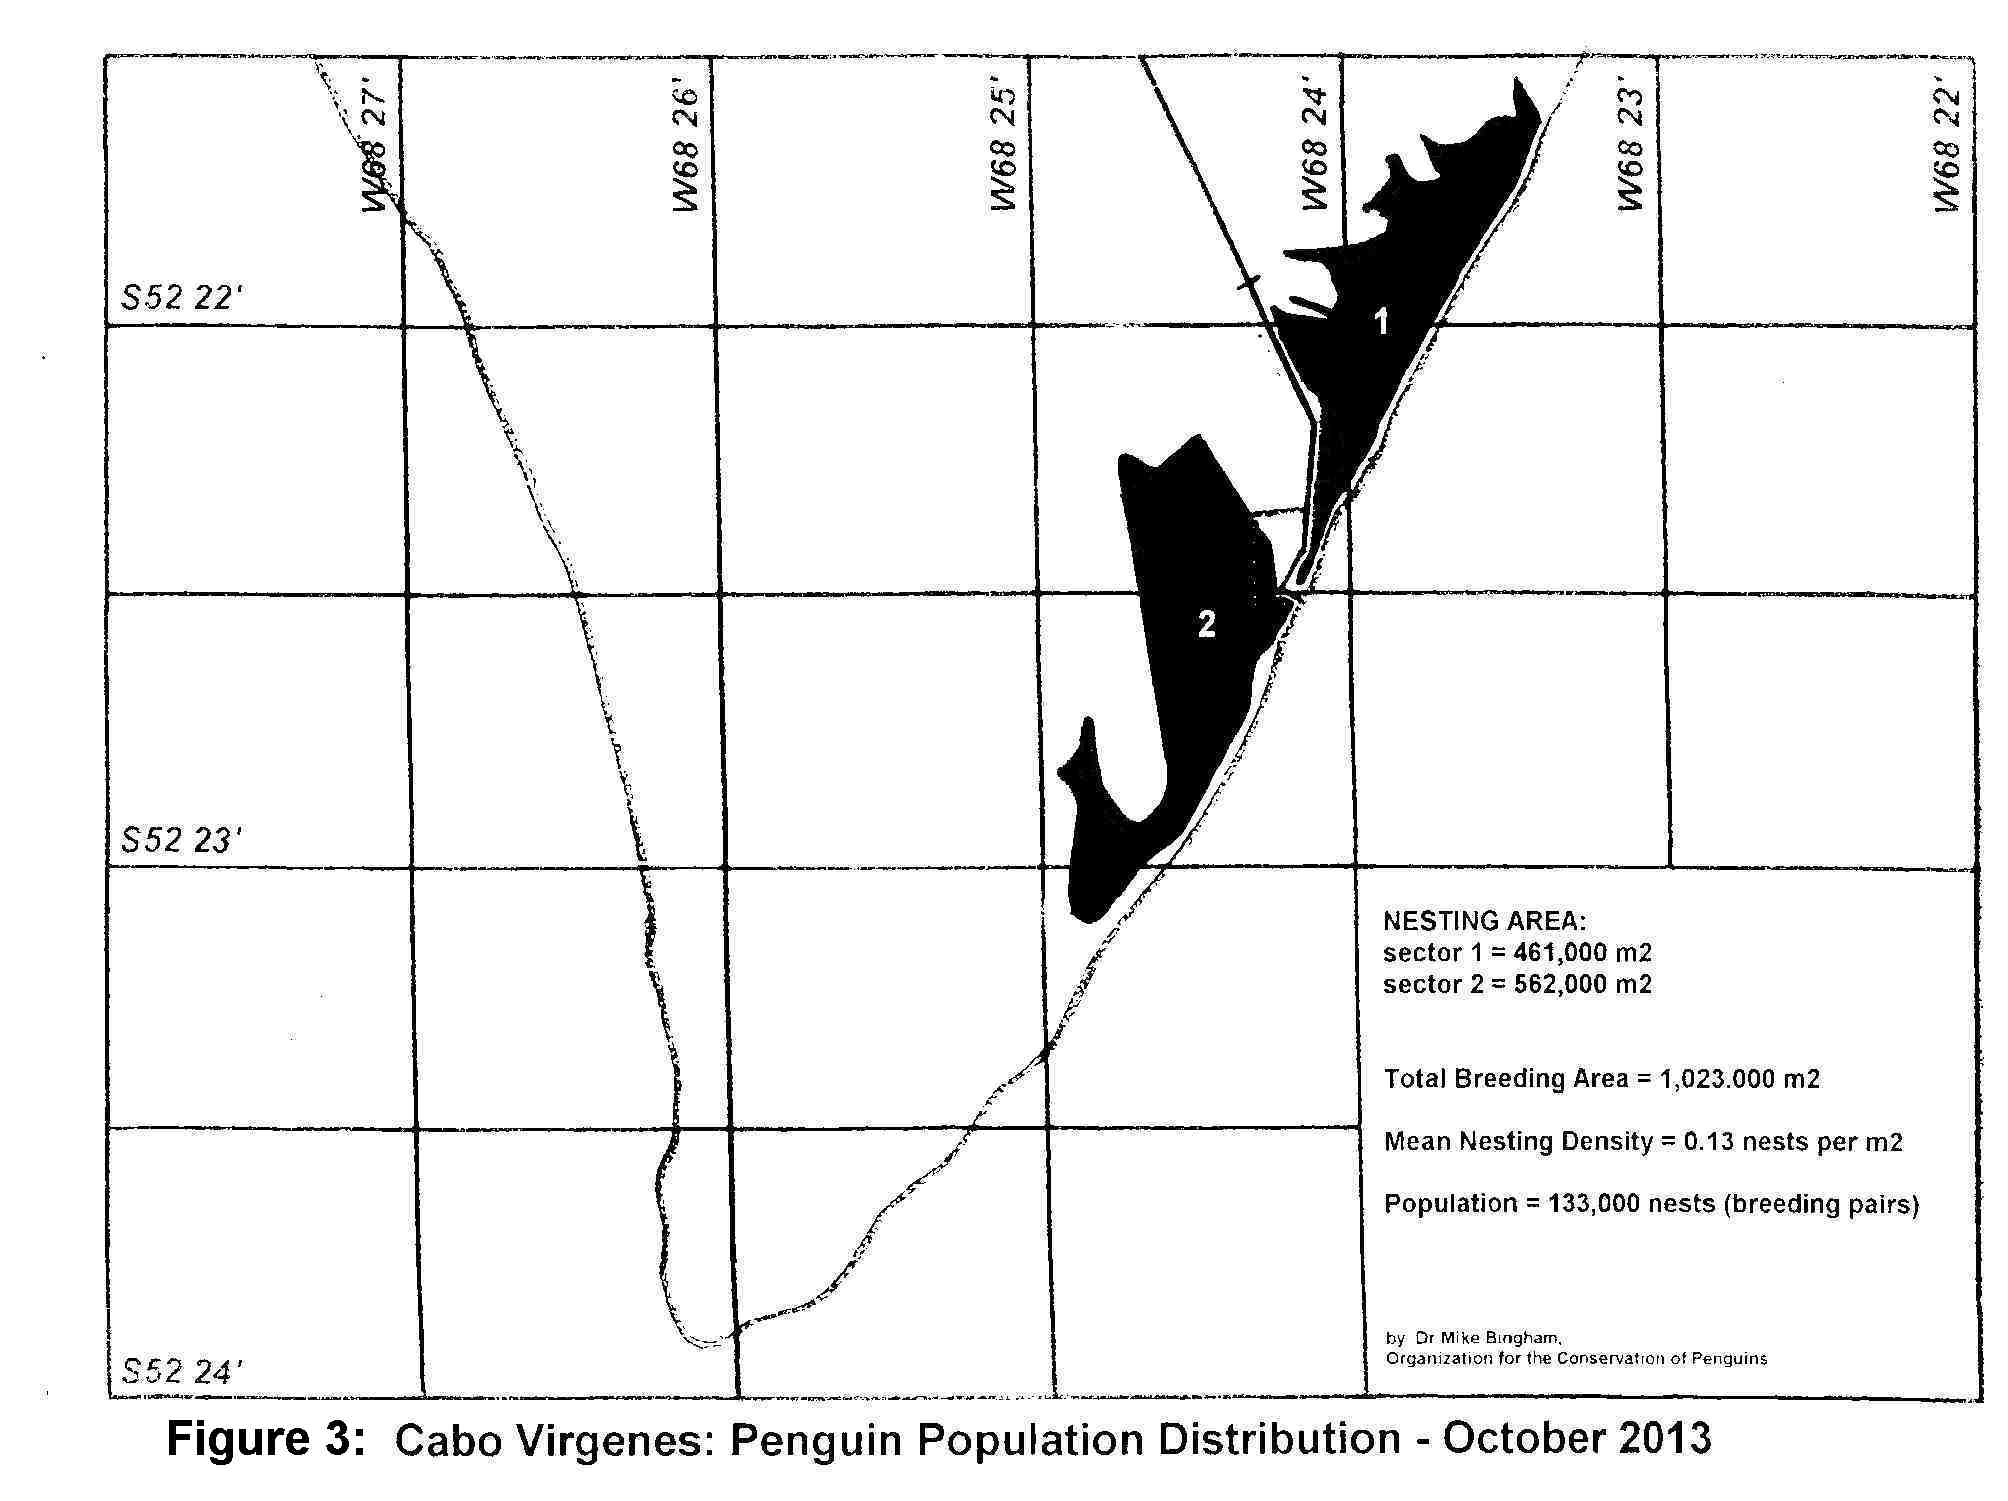
Five such plots were established in October 2003, each plot measuring 50 metres by 50 metres (Fig 2). This gives a total study area of 12,500 sq.m., which is approximately 1.2% of the total penguin breeding area at Cabo Virgenes. These plots are examined in October, immediately after the completion of egg-laying, to count the number of occupied nests, which in turn is used to determine the mean annual breeding density in nests per square metre. The nesting area of the entire colony is also mapped out using GPS, and multiplying the total breeding area of the colony in square metres, by the average number of nests per square metre recorded in the study plots, gives an estimate of the colony’s population size (Bingham 2004. Seabird Monitoring Instruction Manual for Magdalena Island. Organization for the Conservation of Penguins, 22pp.)
The greatest margin for error in determining population size using this method is in the assumption that breeding density recorded in the plots is representative of the entire colony, but by using permanent study plots year after year, this margin for error is eliminated when looking for changes in population size. Even minor changes in breeding density and total breeding area, and hence changes in population size, can be measured with great accuracy using permanent study plots, even though a greater margin of error is implied when extending this to defining an actual population size in any particular year.
Breeding and Behavioural Analysis
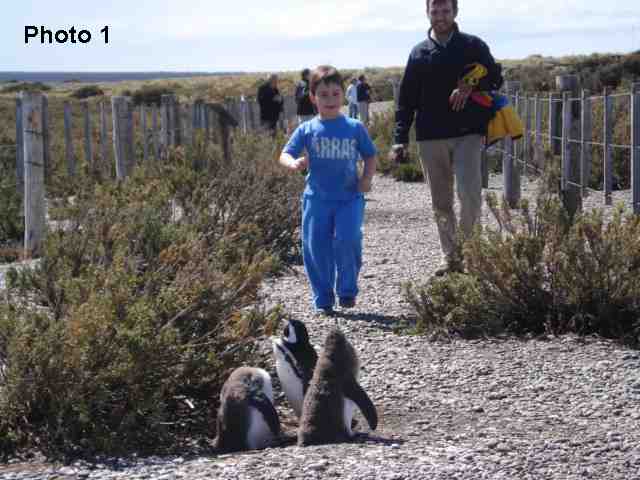
In addition to studying population trends, in late October, immediately after the completion of egg-laying, around 20 occupied nests in each plot are marked, and these nests are visited regularly throughout the season, to determine what proportion of eggs hatch, how many chicks survive to leave the nest, the major causes of egg and chick loss, and chick weight. Of these five study plots, plot 1 is adjacent to the tourist path where tourists walk, whilst plots 4 and 5 are in areas far away from tourists and human disturbance, allowing us to look for differences in breeding success and chick survival rates resulting from the presence of tourists. A small number of penguins choose to nest within the tourist path, despite having tourists walking around (and even over) their nests throughout the breeding season (Photo 1). These nests were also marked and studied for comparison, to see how they cope with such extreme disturbance.
RESULTS AND DISCUSSION
Penguin population census results show a population increase from 120,000 breeding pairs in 2003/04 to 133,000 breeding pairs in 2013/14 (Fig. 3).
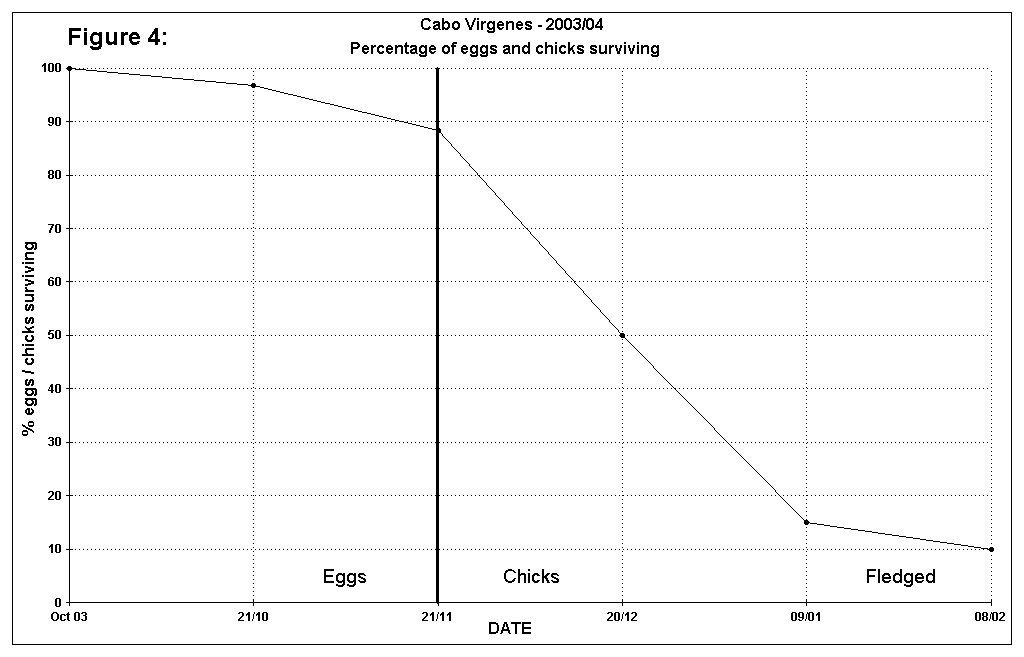
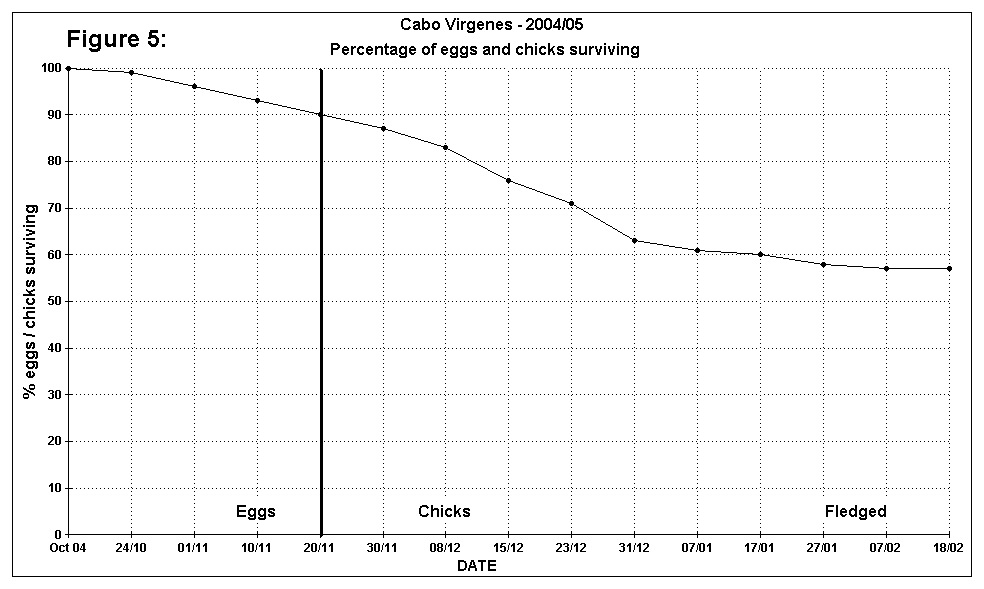
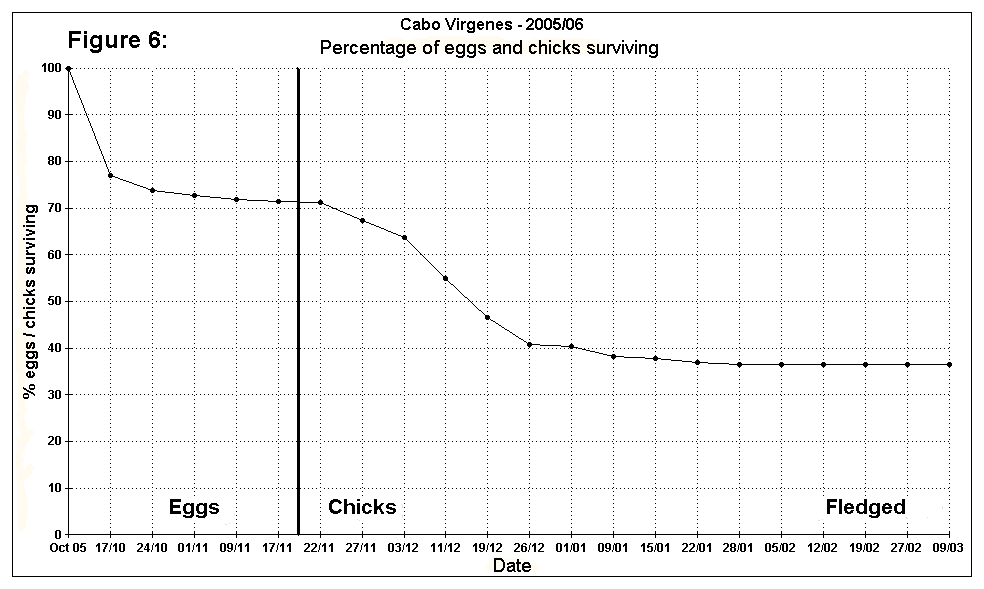
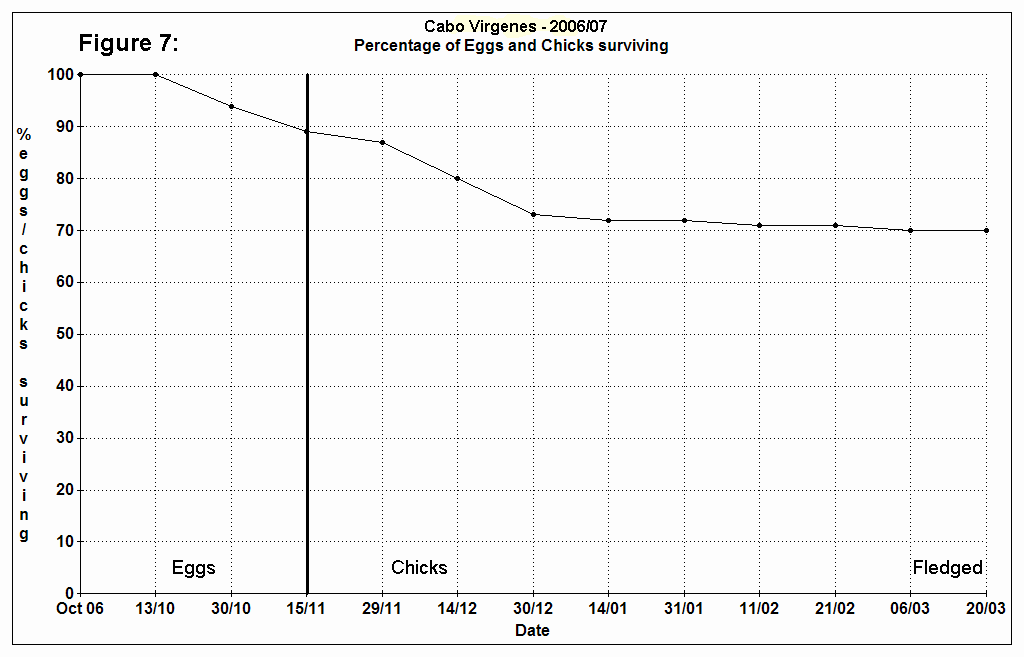
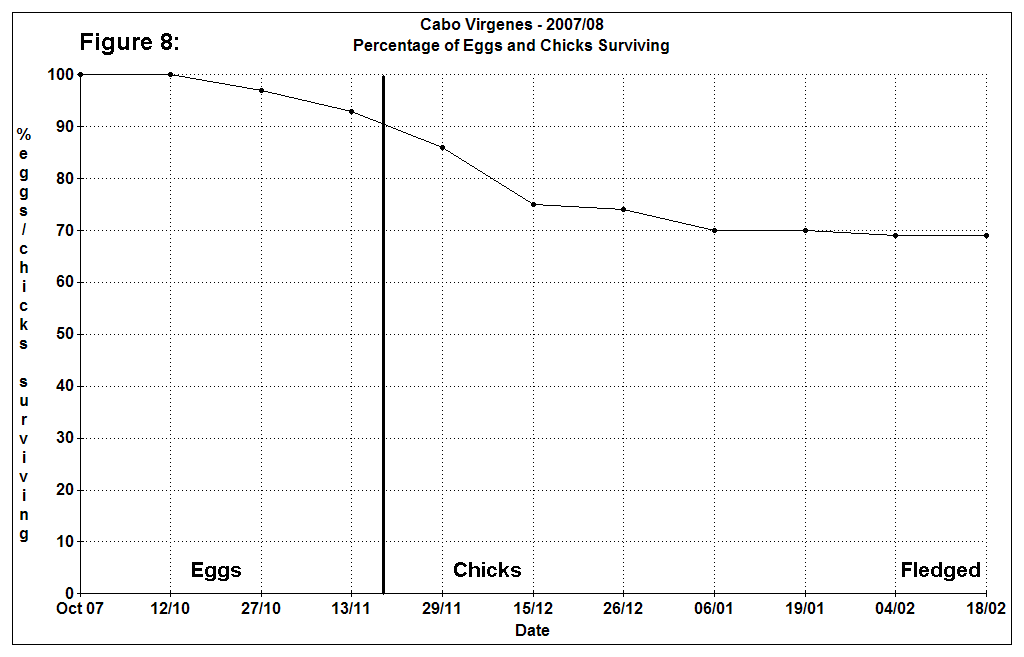
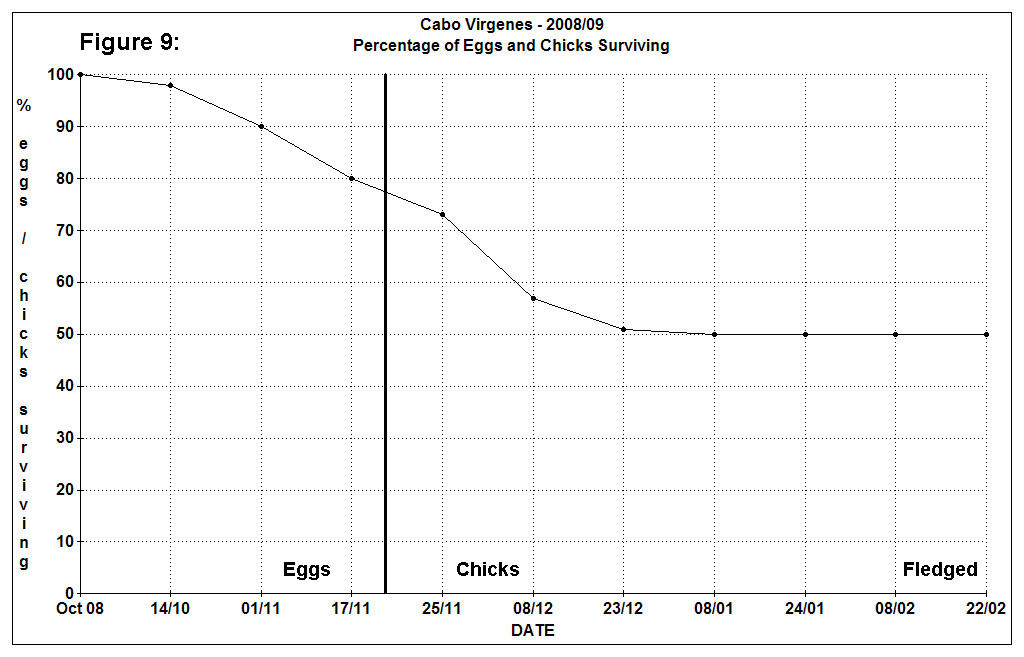
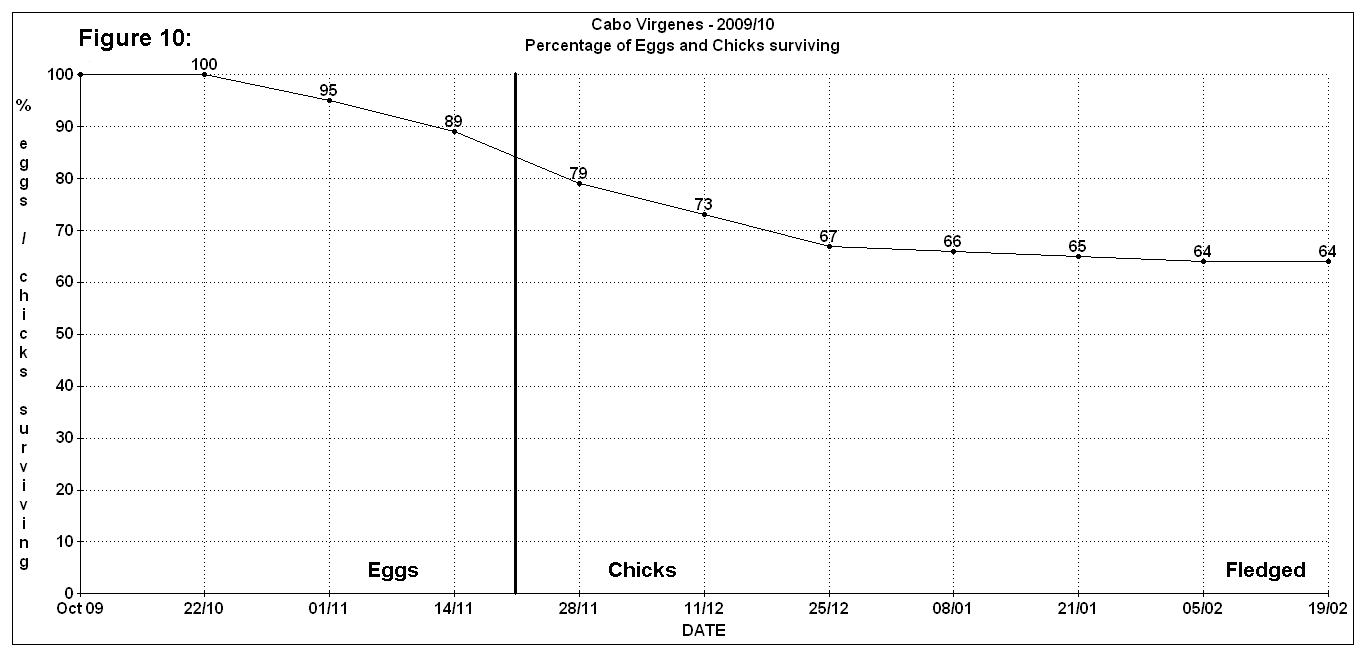
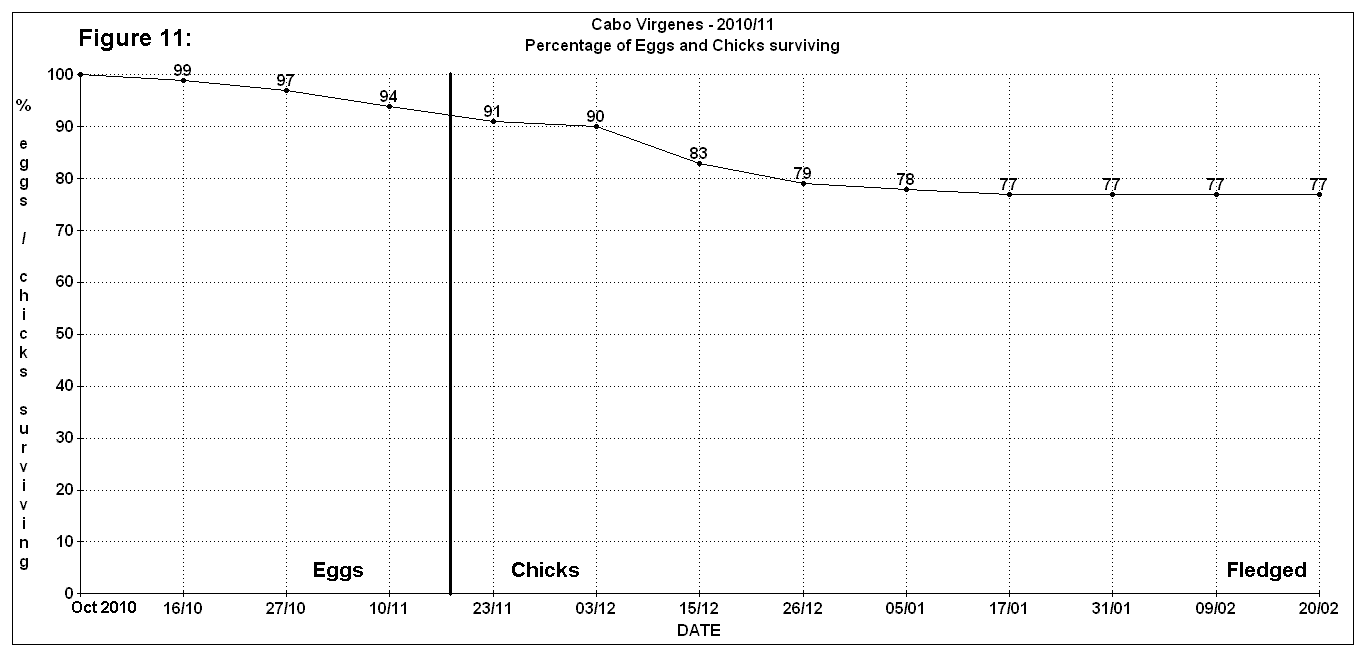
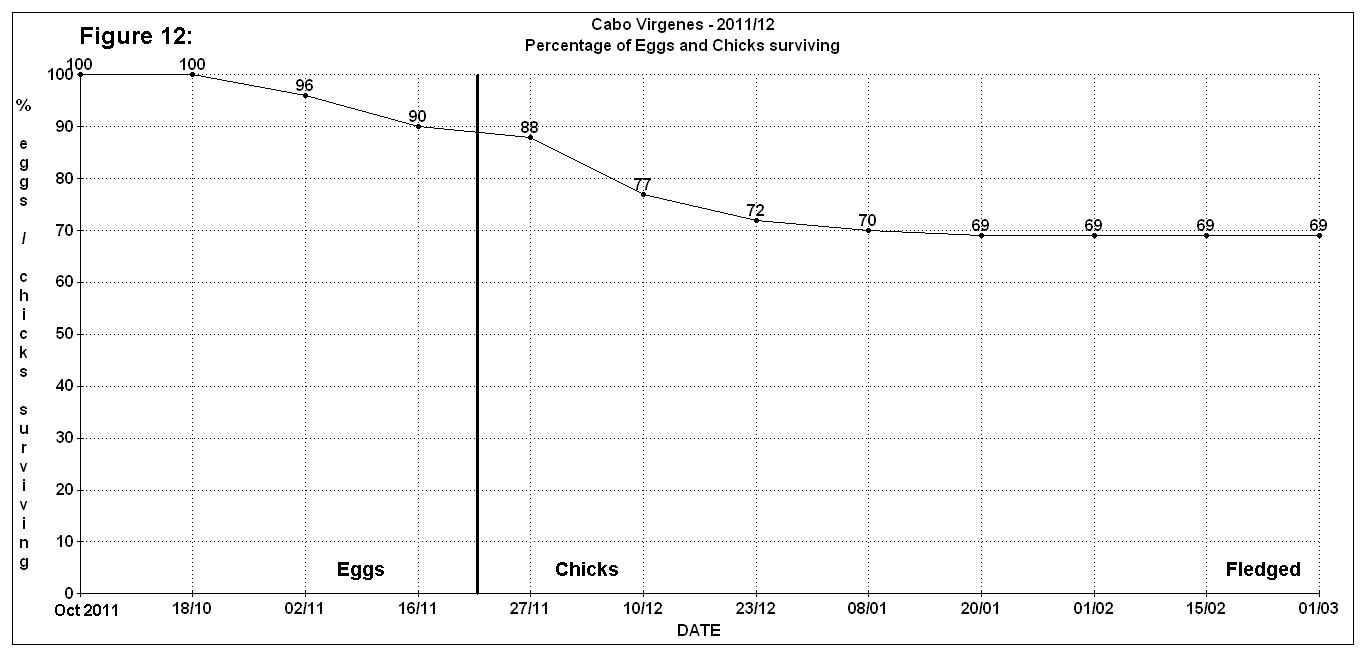
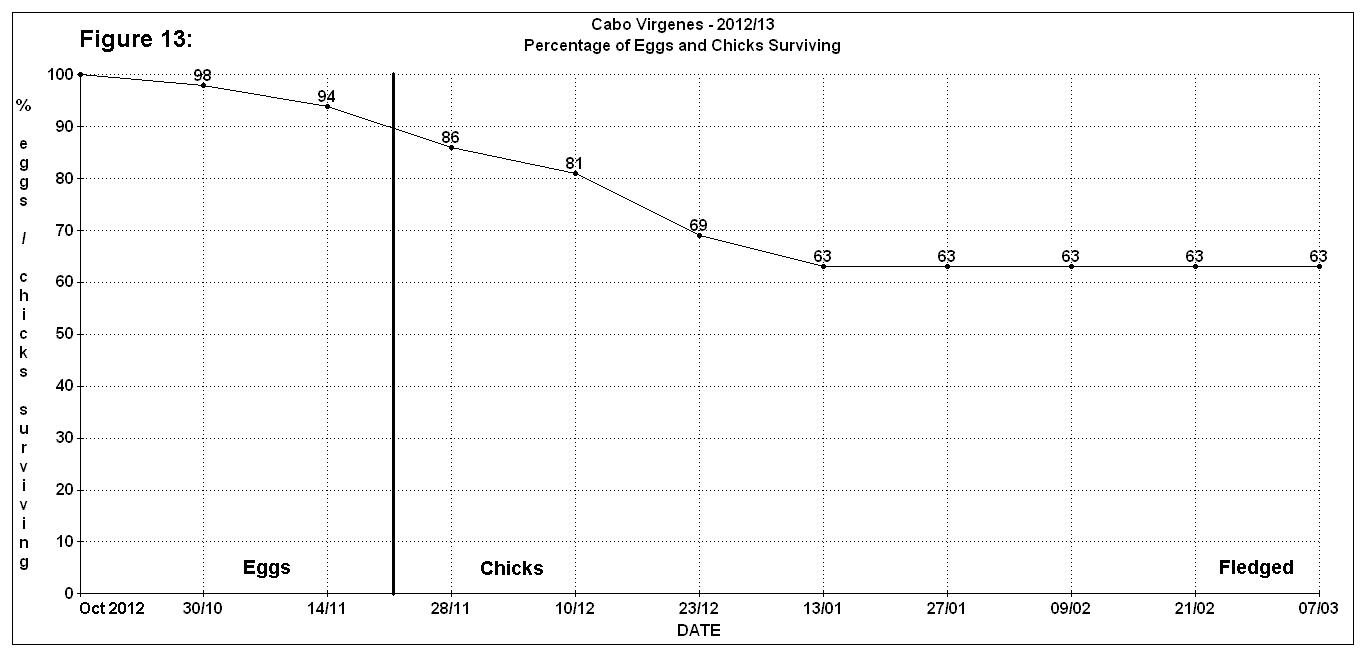
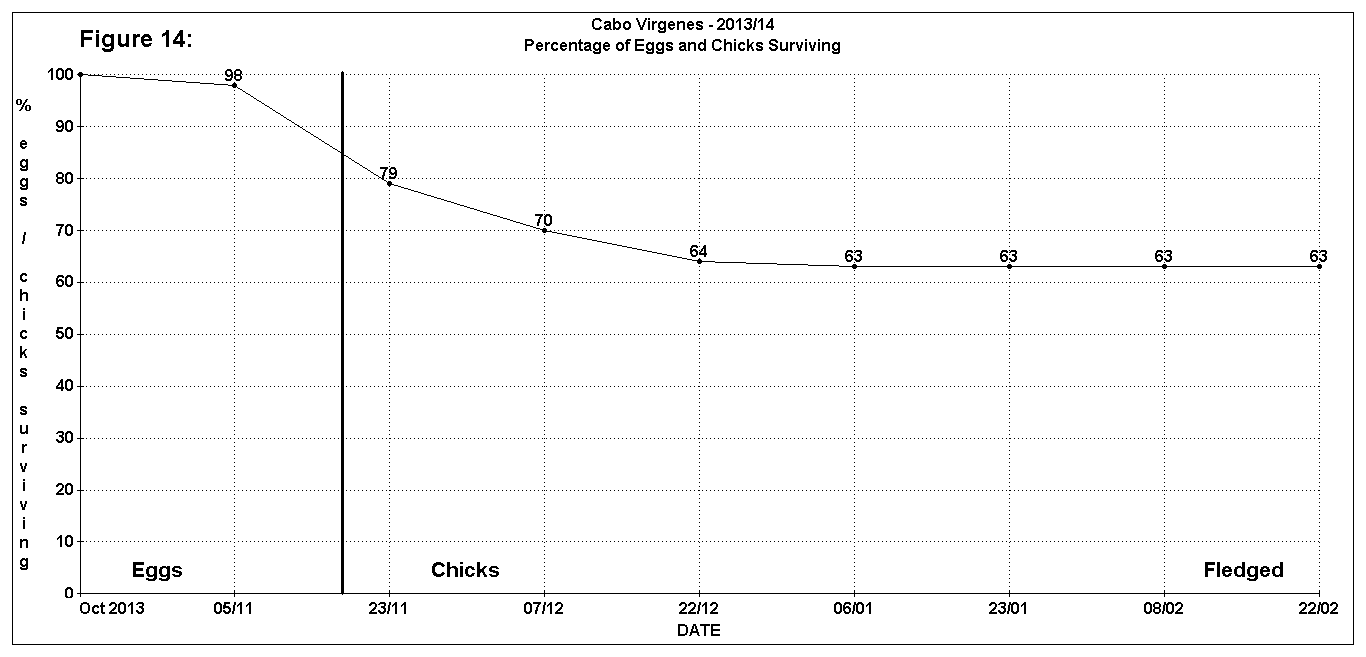
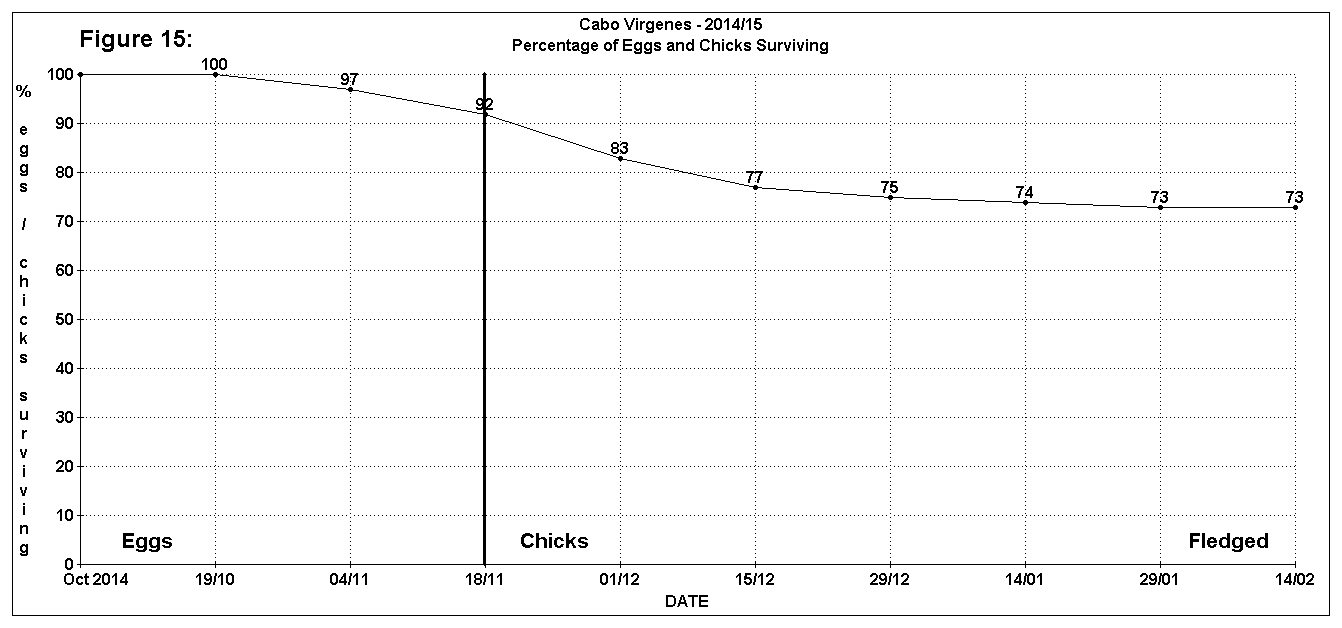
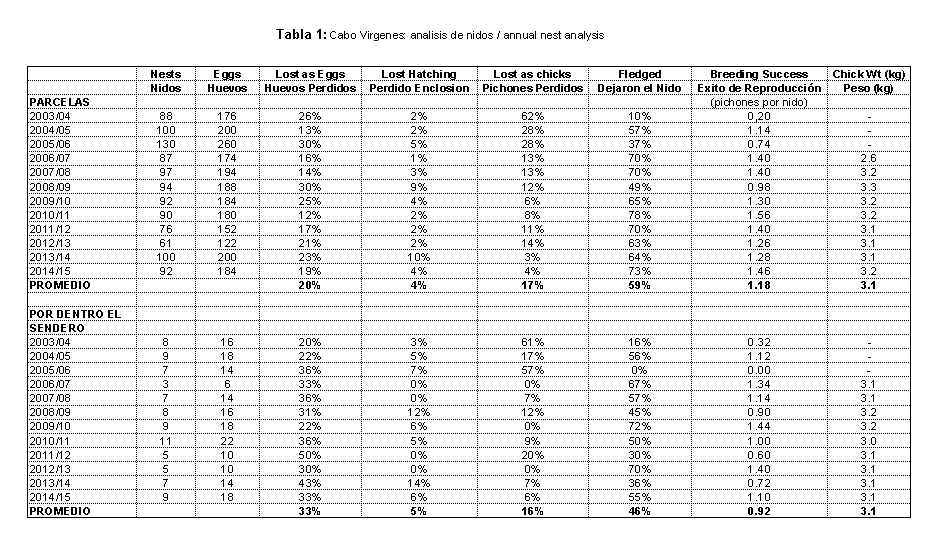
Studies of marked nests each year support the evidence of a healthy population. Breeding success over the last 12 years (2003/04 to 2014/15) has averaged around 1.18 chicks per nest for the colony as a whole (Table 1, Figs. 4 to 15). Chick weight at the point of fledging has averaged 3.1 kilograms, indicating that chicks are well fed and healthy. Chicks with high body fat reserves have a good chance of surviving as juveniles after leaving the colony.
Analysis of annual breeding success shows that with the exception of the 2003/04 season, chick losses are low, indicating an adequate and reliable food supply during the important chick-rearing phase. The majority of the breeding failures occur during egg incubation, hatching, and whilst the chicks are small and helpless. These are mostly the result of bad weather, nest abandonment, and parents leaving eggs and small chicks to get cold. Very few chicks died once they reached 14 days of age, which is the age by which they can protect themselves from bad weather and being accidentally trampled. Above this age chick survival is mostly dependent on adequate food supply, and the very low mortality of these chicks supports the notion that food supply is generally reliable and abundant. The lack of high-intensity commercial fishing around the colony certainly plays a role (Bingham 2002).
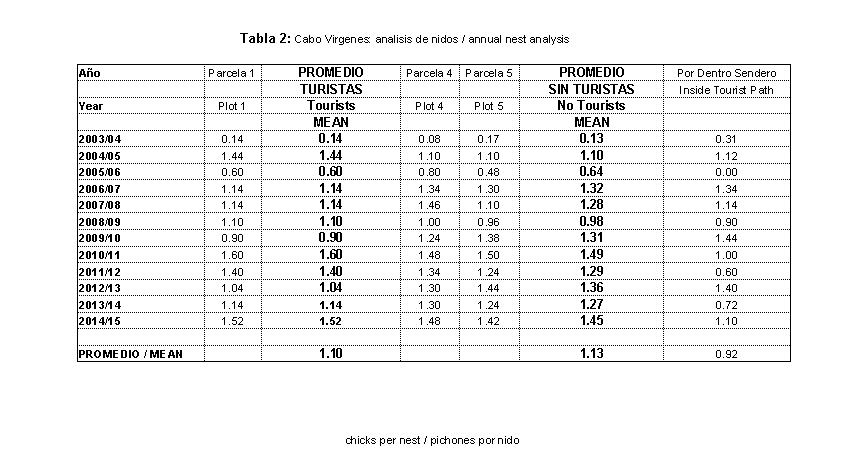
Comparison of nests close to the tourist path, with nests in areas of no disturbance, show very little difference between the two (near to tourists = 1.10 chicks per nest / no tourists = 1.13 chicks per nest) (Table 2).
Penguins actually nesting within the tourist path itself showed a reduced breeding success (0.92 chicks per nest, compared to 1.10 chicks per nest adjacent to the tourist path). This is not surprising, considering that penguins adjacent to the path only have to cope with the stress of people walking by, whilst those penguins nesting within the path face high levels of harassment and disturbance, including people touching the penguins and their chicks. The reduction in breeding success for these nests appears to be as a result of higher nest abandonment during the egg incubation phase, with chick mortality being no higher than for the rest of the colony (Table 1).
The number of penguins nesting within the tourist path is less than 20 pairs, so these results have little bearing on the colony as a whole, but it is interesting that these penguins which face the very worst conditions possible in terms of human disturbance from tourism, still show only an 18% reduction in breeding success, and no reduction whatsoever in terms of chick survival.
It is apparent that Magellanic penguins readily adapt to the presence of tourists, and are comfortable with the current level of tourism at Cabo Virgenes.
CONCLUSION
Annual monitoring shows that the penguin population at Cabo Virgenes is healthy. Breeding success is high, egg and chick losses are low, and chicks are healthy and well fed, suggesting high juvenile survival after leaving the nest. This success is largely due to government protection offered to the colony in the form of on-site park wardens ensuring that tourists keep within the tourist path, and a no-fishing zone around the colony ensuring that the penguins’ food supply is not depleted.
Tourism appears to be having no negative effect on penguins at the present level, except for less than 20 penguins which choose to nest within the tourist path each year, which show a slight increase in nest abandonment during the egg incubation stage.
Studies in the Falklands and Chile show a link between lack of protection from commercial fishing and penguin population decline. In the Falklands, where the government refuses to protect penguins from commercial fishing, Magellanic penguin populations have declined by over 90% since the establishment of the commercial fishing industry in 1988,.and breeding success is greatly reduced each year as a result of annual chick starvation (Bingham 2002). The nearest Magellanic penguin colonies to the Falklands are Cabo Virgenes in Argentina, and Magdalena Island in Chile, both of which are protected from commercial fishing by no-fishing zones.
Magdalena Island has been studied for comparison with the Falklands since 1998, and this population is healthy and expanding, with very high chick and juvenile survival (Bingham and Herrmann 2008), whilst the Falklands colonies have declined, with mass chick starvation occurring each year (Bingham 2002). The fact that the penguin colony at Cabo Virgenes is also healthy and stable, with high chick survival, adds further evidence that protection from commercial fishing is a key factor in penguin survival. It can only be hoped that eventually the Falklands government will also begin to employ no-fishing zones around penguin colonies, in order to halt the continuing decline of their penguins.
Oil spills from passing maritime traffic through the Straits of Magellan, and from the numerous oil rigs operating in the area, are a constant threat that could seriously damage the colony at any time in the future without warning. Over the last 12 years, several minor spills have occurred around Cabo Virgenes, oiling small numbers of penguins that have been cleaned and released by park wardens. In 2009, new facilities were constructed at Cabo Virgenes to handle oiled penguins in the future, but with 270,000 penguins breeding along this small section of coastline each year, the potential for disaster is ever present.
ACKNOWLEDGMENTS
Our special thanks go to all the staff of the Dirección de Fauna Silvestre y Areas Protegidas Rio Gallegos, especialmente Marcos Clifton, Beatriz Ortega, Jorge Serra, Cesar Aminahuel, Pablo Nuñez, Carlos Raúl Oliva, Mario Beroiz, Pablo Irazoqui, Angel Mansilla, Oscar Palacios, Alberto Battini, Graciela Oyarzo, Fabián Tejerizo y Jorge Perancho. Our thanks also to the Fenton family at Estancia Monte Dinero.
LITERATURE CITED
Bingham M. (1998) Penguins of South America and the Falkland Islands. Penguin Conservation 11(1): 8-15.
Bingham M. (2002) The decline of Falkland Islands penguins in the presence of a commercial fishing industry. Revista Chilena de Historia Natural 75: 805-818
Bingham M. and Mejias E. (1999) Penguins of the Magellan Region. Scientia Marina Vol:63, Supl. 1: 485-493
Bingham M and Herrmann T (2008) Penguin Research Results for Magdalena Island (Chile) 2000 - 2008. Anales Instituto Patagonia (Chile) 36(2): 19-32.
Gandini P., Frere E. and Boersma P.D. (1998) Status and conservation of Magellanic Penguins in Patagonia, Argentina. Bird Conservation International.
FIGURES, TABLES AND PHOTOS
.
.
.
.
.
.
.
.
.
.
.
.
.
.
.
.
.
.
.
.
.
.
.
.
.
.
.
.
.
.
.
.
.
.
.
.
.
.